

The Growing Tax Base Divide
Minneapolis and St. Paul are facing a fiscal accounting problem that is quickly becoming an acute crisis.
Cities raise the money they need to function by taxing property within their borders. When the commercial and industrial share of that tax base grows, everyone benefits: Government services are funded without placing an ever-heavier burden on homeowners, and the conditions that attract further investment, stable taxes, well-maintained infrastructure, and high functioning schools remain intact. When that commercial base shrinks, the burden shifts, homeowners pay more, and the city becomes a less attractive place to live, invest, or stay.
That arithmetic is now playing out very differently across the Twin Cities metropolitan area, and the divergence carries lessons that no local official, homeowner, or business owner can afford to ignore.
Six cities, 10 years of data
Consider the combined commercial and industrial estimated market value (EMV) trajectories of six representative Twin Cities municipalities from 2016 through 2026: Minneapolis, St. Paul, Edina, Bloomington, Roseville, and Woodbury. The data are preliminary estimates drawn from official sources, though Roseville and Woodbury data for previous years are author estimates.
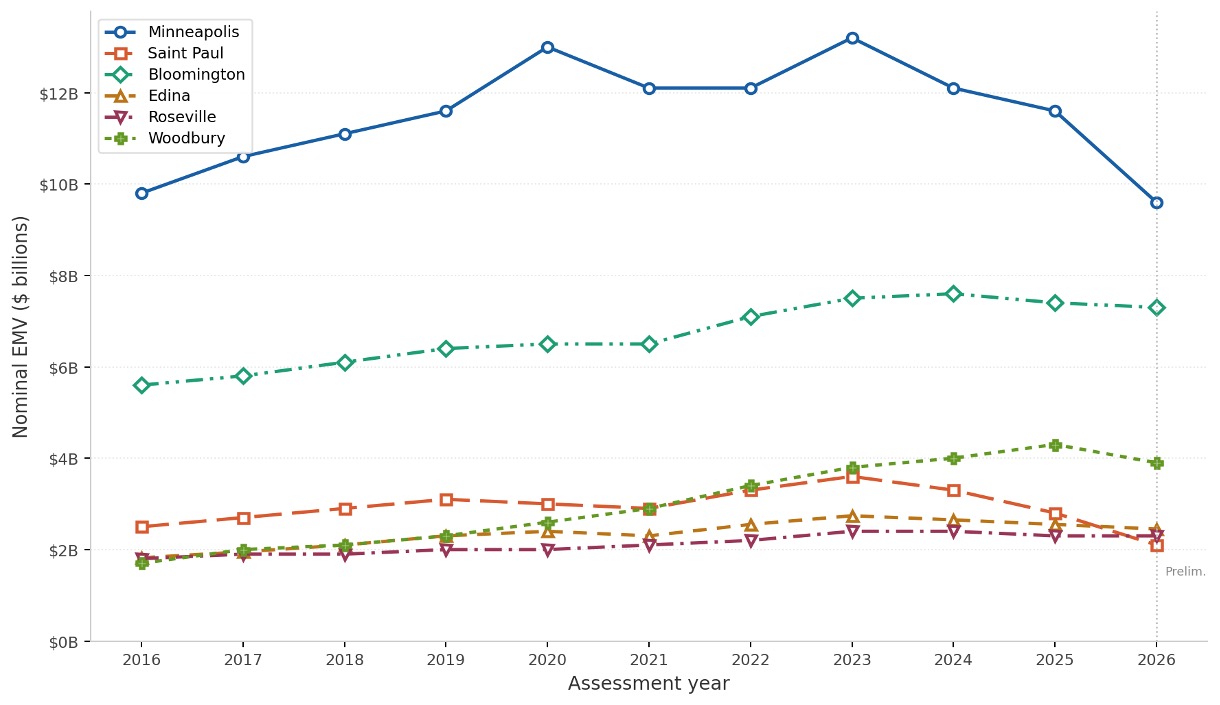
Figure 1. Combined commercial and industrial estimated market value (EMV) for six Twin Cities municipalities, 2016-2026, in nominal dollars. The Minneapolis figure of $9.6 billion used in this analysis represents the estimated combined commercial and industrial EMV, consistent with the scope applied to all other cities in the comparison. Sources: City of Minneapolis Annual Assessment Reports; City of Saint Paul Annual Comprehensive Financial Reports; Ramsey County Assessor records; Hennepin County assessment records; City of Bloomington Assessing Division Annual Assessment Reports; Washington County assessment records; individual city Annual Comprehensive Financial Reports. Roseville and Woodbury figures are author estimates.
Figure 1 presents combined commercial and industrial EMV for all six cities across the decade. Minneapolis carries the largest absolute commercial and industrial base, peaking at $13.2 billion in 2023 before its sharp decline; St. Paul follows, its base substantially smaller in absolute terms despite a sizable downtown commercial core; Bloomington’s combined base, anchored by the Mall of America, extensive hospitality infrastructure, and a major industrial corridor, places it third and well above the smaller suburban cities. Roseville and Edina are broadly comparable in scale, while Woodbury, despite its rapid growth, remains the smallest commercial base in the group in absolute terms.
The pandemic penalty
The pandemic left visible marks on every city in this analysis. Commercial values dipped or flattened in 2020 and 2021 across the board, as office occupancy collapsed, retail traffic dried up, and hotel revenues fell sharply. The pandemic hurt all cities. That is true. But it is only half the story, and arguably the less important half.
What the comparative data reveal is that cities did not come out of the pandemic the same way. Some recovered and came out stronger. Others did not recover at all. The pandemic may explain a dip; it does not explain a decade-long divergence that was already underway before 2020 and that accelerated sharply in the years after.
Woodbury, Bloomington, Edina, and Roseville faced the same regional economy, the same interest rate environment, and the same remote work disruptions, yet followed fundamentally different paths. A shared external shock does not produce shared outcomes when the underlying policy environments, investment climates, and land use conditions differ. The pandemic is a partial explanation that, leaned on too heavily, becomes an excuse for avoiding harder questions.
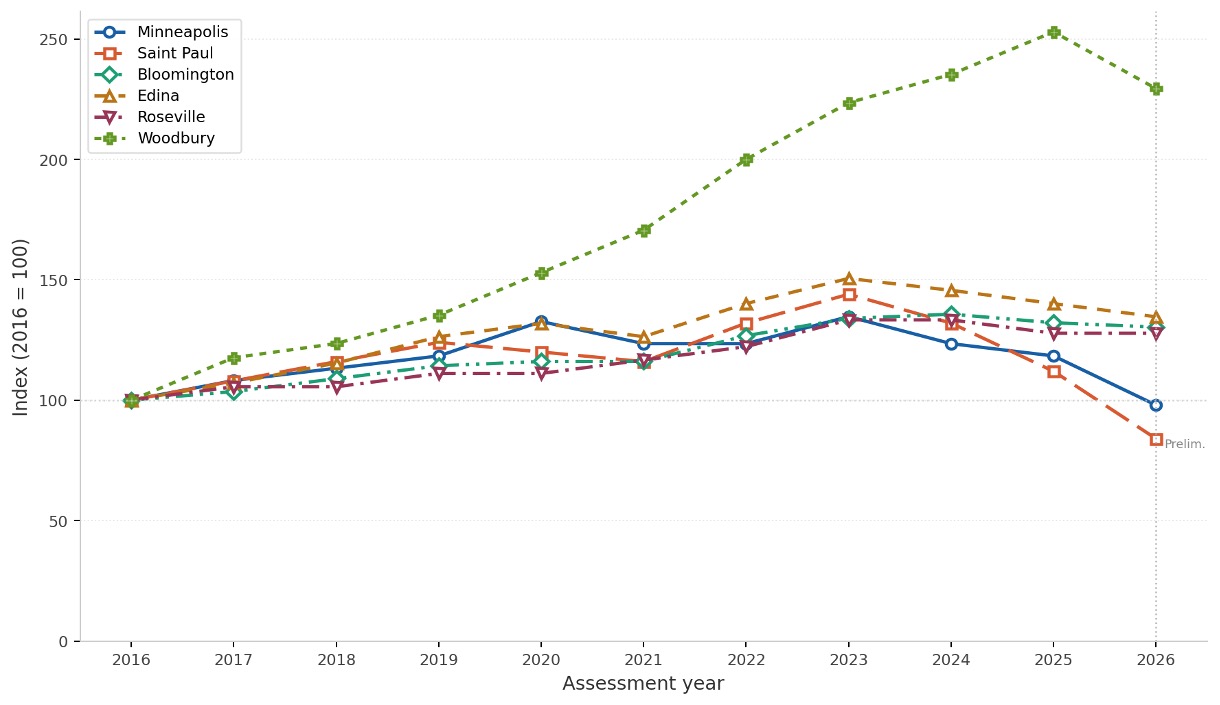
Figure 2. Combined commercial and industrial EMV indexed to 2016 = 100 for each city, allowing direct comparison of growth trajectories regardless of differences in the scale of each city’s commercial base. The horizontal dotted line marks the 2016 baseline. Sources: same as Figure 1.
Figure 2 reveals relative trajectories with clarity. Woodbury stands apart from every other city in the comparison, finishing the decade more than 120% above where it started, a reflection of sustained commercial expansion driven by substantial developable land, a growing population, and a planning culture that has actively encouraged employment generating uses. Bloomington and St. Paul both show meaningful gains over the full decade, though St. Paul’s post-2023 slide has begun to erode its earlier progress.
Edina and Roseville cluster in the middle, both inner-ring suburbs showing moderate appreciation through the mid-period with mild softening in recent years. Neither is in crisis, but neither is growing its commercial base in a way that provides much fiscal headroom.
And then there is Minneapolis, the unmistakable outlier.
Minneapolis’ combined commercial and industrial EMV, which peaked at $13.2 billion in 2023, has since fallen to an estimated $9.6 billion in 2026, its lowest level since 2019 and, in inflation-adjusted terms, the lowest point in the entire 10-year period. The commercial-only figure stands at $7.8 billion, down from $8.6 billion the prior year, confirming the depth of the decline by any measure.
In indexed terms, Minneapolis is the only city in this comparison to finish the decade below its own 2016 baseline. City assessor Rebecca Malmquist reported that downtown commercial values fell 9.5% in a single year, with urban-core office buildings losing roughly 22% of their assessed value in 2025 alone. The commercial sector’s share of the city’s total net tax capacity has dropped from 34.7% in 2016 to just 24.9% in 2026, a loss of nearly 10 percentage points in a single decade.
St. Paul’s trajectory is troubling in a different register. Its commercial base has now fallen below its 2016 starting point, but three consecutive years of decline, from a peak of $3.6 billion in 2023 to a preliminary $2.1 billion in 2026, signal that the city’s fiscal pressures are structural, not simply a hangover from a once-in-a-century public health crisis.
First, the timing is wrong for a pandemic explanation: St. Paul’s commercial base peaked in 2023, three full years after Covid hit, and has fallen sharply since—exactly the inverse of a recovery arc. Second, peer cities faced the same regional economy, the same interest rate environment, and the same remote work disruptions, yet Woodbury finished the decade more than 120% above its 2016 baseline while St. Paul slides toward its starting point. Third, three consecutive years of decline from a peak is a trend, not a lag—a pandemic hangover produces a temporary dip and rebound, not a sustained contraction with no visible floor.
Disruption or divergence?
This analysis does not adjudicate the causes of Minneapolis’s commercial decline. Reasonable people disagree about the relative weight of remote work, crime, rent control spillovers, tax increment financing overuse, and the structural hollowing out of downtowns that has affected cities across the country. What the data make clear is that the consequences are already here: homeowners asked to carry a larger share of the levy, schools asked to do more with less local revenue, and business tax obligations rising as the base beneath them contracts.
The cities faring better in this comparison did not stumble into their trajectories by accident. Woodbury’s commercial growth reflects decades of disciplined land use planning, infrastructure investment, and a genuine commitment to welcoming employment-generating development. Bloomington has leveraged its geography and connectivity to build a diversified commercial base that absorbed the pandemic’s shocks without structural damage. These achievements demonstrate that the arithmetic of the tax base is not beyond the influence of local decision making.
For Minneapolis and St. Paul, the urgency is real. A shrinking commercial tax base does not stabilize on its own. Rising residential tax burdens, constrained services, weakened schools, and reduced affordability are precisely the conditions that make further commercial investment less likely. The comparative record of the past decade makes one thing unmistakably clear: The pandemic explains a disruption. It does not explain a divergence. And it is the divergence that demands attention.