


Health Care: The Gift that Keeps on Giving
I’m a sucker for holiday traditions. No matter how frenzied and unpredictable the year was, I know I can count on Chinese food on Christmas Eve and a new pair of gym shoes waiting for me under the tree. In keeping with that spirit, we’ll end the year of Explanation of Benefits the same way we did last year—with a page full of updates.
Employers rank the costliest chronic medical conditions
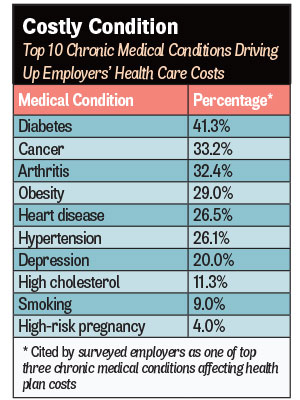
As I’ve said before, I don’t mind being wrong, but I love being right. Last month, we warned employers to take diabetes more seriously. Well, guess what? Diabetes topped the list of the costliest chronic medical conditions for employers. That’s according to a survey of 530 employers by the International Foundation of Employee Benefit Plans for the IFEBP’s 2017 Workplace Wellness Trends report (bit.ly/1QX4LEc). Some 41 percent of the employers—431 from the U.S. and 99 from Canada—cited diabetes as the most expensive chronic medical condition their workers had (see chart). More than 90 percent said they offered wellness-related programs for their employees, but less than half—48.1 percent—said they included disease management services. Even less said they offered nutritional counseling or healthful food choices in cafeterias and vending machines, at 33.2 percent and 44 percent, respectively.
Doctors say much medical care is unneeded, but blame patients for making them do it
In September, we talked about the use of unnecessary medical treatments and overspending on necessary medical treatments that could be provided for less (bit.ly/2hIqoB5). Both drive up health care costs for employers. As it turns out, most doctors agree with me. Researchers from the Harvard Medical School and the Johns Hopkins University School of Medicine asked 2,106 physicians about their views on wasted medical treatment, its causes and possible solutions. The consensus, published in the journal PLOS One, was that 25 percent of diagnostic lab tests are unnecessary, as are 22 percent of prescription medications, 21 percent of overall medical care and 11 percent of medical procedures (https://bit.ly/2h3rrv8). They cited fear of malpractice lawsuits (85 percent), pressure from patients (59 percent) and difficulty accessing patients’ previous medical records (38 percent) as the top three causes of overtreatment. Their top three solutions were: training residents on appropriate treatment criteria (55 percent); easy access to previous patient medical records (52 percent); and more practice guidelines (52 percent). Here’s another one: employers and their health plans refusing to pay for care that’s clearly unnecessary. “Physician engagement is needed to address the problem of overtreatment in health care,” the researchers concluded. Talk to your doctor.
State lauded for EHR use, dinged for price transparency
Here’s another one for your “it’s always good to know where you stand” file. A Washington-based think tank called the Center for Data Innovation ranked Minnesota 11th out of 50 states for data innovation (bit.ly/2vt8ecj). The group used 25 metrics in three broad categories—ensuring data is available to use, enabling key technology platforms, and developing human and business capital—to calculate an overall data innovation score for each state. Massachusetts was first; Mississippi was last. Of the 25 measures, three were specific to health care: e-prescribing, health care price transparency and electronic health record adoption. Minnesota ranked 14th, last (along with 42 other states) and fourth, respectively. The most valuable part of the 85-page report is the list of 25 data innovation measures. It’s a to-do list to make the data we’re all swimming in more useful.
We don’t need no stinking health care price transparency tools
Way back in April 2014, this column advocated for health care quality and price transparency and recommended that employers give workers tools to let them comparison-shop for their own medical care (bit.ly/2vOJvi2). A study in Health Affairs looked at the impact of a transparency tool on spending on three “shoppable” services: lab tests, physician office visits and advanced imaging services (bit.ly/2uG6omM). The California Public Employees Retirement System gave more than 200,000 state employees access to a website and a mobile app that let them compare prices for the three services among in-network and out-of-network providers. After 15 months, only 12.3 percent of employees used the tool to do a price search. Spending on lab tests and office visits by employees who did a search and those who didn’t was the same. Spending on advanced imaging services was a little lower. “Simply increasing deductibles and introducing price transparency tools will not induce consumers to price-shop and thus lead to declines in spending,” the study said.
Minnesotans’ opioid use lower than U.S. rate, Blues study says
Put this in your “it could be worse” file. The Blue Cross Blue Shield Association analyzed medical and pharmacy claims filed from 2010 through 2016 by more than 30 million Blues-insured enrollees under the age of 65, looking to measure the extent of the opioid problem in its commercially insured patient base. Its analysis, released in a 12-page report, found that things are a little better in Minnesota than across the nation (bit.ly/2t6diiy):
- 13.5 percent of Blues enrollees here filled at least one opioid prescription in 2015, compared with 21.4 percent nationally
- 1.8 percent of Blues enrollees here were on a long duration opioid regimen in 2015, compared with 3.8 percent nationally.
- The opioid use disorder diagnosis rate per 1,000 Blues enrollees here was 3.5 in 2016, compared with 8.3 nationally.
- For an in-depth look at how the opioid crisis is affecting Minnesota employers, read “The Workforce’s Hidden Addicts” by Burl Gilyard in the October issue of Twin Cities Business (bit.ly/2fEou0d).
David Burda (@davidrburda; dburda@msp-c.com) is editorial director, health care strategies, for MSP-C, where he serves as the chief health care content strategist and health care subject matter expert.